Confessions of a Marketing Veteran: The CPA Guessing Game
Have you ever felt like you’re throwing darts at a board when it comes to setting your marketing targets and budgets? I know I have – and I’ve been in this game for over 7 years. Well, I’ve got a confession to make…
For too long, I operated that way myself. Asking clients for their target cost per acquisition (CPA) only to get wildly different responses that seemed plucked out of thin air. “I want leads under $20 and customers under $1,000” or “I don’t care about the cost per lead (CPL) as long as sales cost under $500.” It’s all over the place. No rhyme or reason behind it.
Want to brainstorm with our team on new ways to scale your business with YouTube Ads (and other performance video platforms)?
Join us for a free YouTube ad brainstorming session👇
And it got me wondering – how are they coming up with these figures? What’s the logic or process behind setting these numbers? Because from where I’m sitting, most people are going with their gut instead of any kind of systematic approach.
Is Your Business Really Profitable?
From my experience working with the clients, CPA targets tend to be set ad-hoc, rather than being tied to their actual business plans and financials. They are satisfied with a $1,000 CPA for their $2,000 coaching program. But why? How did they determine that $1,000 is the right number?
Sure, I get that selling something for $2,000 while spending $1,000 means you pocket $1,000 in theory. But what about all your other expenses? Advertising is just one slice of the pie. You can’t look at it in isolation.
This siloed approach to KPIs is what I call “target practice.” We’re so focused on hitting our CPA or CPL goals for a particular channel, we miss the broader target of maximizing overall business profitability.
But here’s the hard truth: if you’re not seeing your business holistically, applying a real systematic process for setting targets and budgets, you’re leaving money on the table. Lots of it.
And profitability, as I’m sure you’ll agree, has to be the #1 priority for any company aiming to be sustainable and growth-focused.
Leveraging the Info Product Advantage
Luckily for info product entrepreneurs, their whole business model tends to orient naturally around the bottom line and cash generation. But only if we get our aim right from the start…
That’s exactly what I’ve been obsessed with lately – creating a framework any info product biz owner could use to map out their financial model and KPI goals in a methodical way. A system that would clearly show:
- How to set your total advertising budget
- How to derive target CPAs and other advertising KPIs from that
- Where your bottlenecks are holding you back
- What priorities to focus on first
- How to communicate this whole plan to your team and partners
A system that optimizes for profits above all else.
Because at the end of the day, randomly shooting from the hip just doesn’t cut it if you want to consistently hit your numbers and scale sustainably.
The info product world, similar to SaaS, has a huge advantage – there’s no added cost for each new customer. Once the initial product is created, you can sell it over and over with virtually no extra expenses. This is what makes the model so lucrative and appealing.
Yet, I’d argue this very advantage can breed complacency when it comes to setting business goals and targets. We often get stuck looking at each individual sale, instead of stepping back to view the big financial picture. Why does it matter?
Anchoring to Your Financial Foundations
Think about it – that new course you just sold didn’t actually cost you anything extra to produce and deliver, right? But running the overall business machine still has lots of unavoidable costs. Having zero marginal costs per unit is incredibly powerful, but only if you’ve got a solid handle on managing all your other operational and variable expenses.
Operational and variable costs – what exactly do those terms mean? This is where I see many business owners start to get tripped up.
In any business, there are three core financial statements that you must stay anchored to:
1. The Profit & Loss statement (P&L) – This acts like a report card, showing if you made or lost money over a certain period.
2. The Balance Sheet – This is a snapshot of everything your company owns (assets) and owes (liabilities) at a given point in time.
3. The Cash Flow Statement – Think of this as a cash diary, tracking all the money coming in and going out to show if you’re managing your cash flow effectively.
These three statements provide the full financial picture and health status of your business. They reveal whether you’re actually generating positive free cash flow – which should be the #1 aim of any business activity.
And, importantly for us, these core financial statements must form the foundation for setting all your KPIs, goals, targets, and budgets – including marketing.
How Often Do You Review Your Financial Statements?
From my experience in the direct response business, most marketers and product owners rarely look at these statements until the end of year. And when they do, it’s mainly for tax reasons. Having to comb through the financials at that point is never a pleasant experience. It’s even more painful when you realize just how much of your hard-earned profit needs to go towards taxes.
But here’s the key. Trying to set business targets without first basing them on those core P&L, Balance Sheet, and Cash Flow documents is like trying to navigate blind. You have no compass or map to guide you. It’s a recipe for getting completely lost and making poor decisions.
Every strategic activity, every KPI you track, every budget you set – it all needs to be rooted in and consistently realigned to those three critical financial statements. They should be the North Star that you refer back to time and time again.
How to Map Out Your P&L Model
So now you may be wondering: “Okay, but how can financial statements help me set targets like cost-per-acquisition or my marketing budgets? Where do I start?” Well, let me walk you through it…
For the purposes of mapping this all out, we’ll focus solely on the P&L statement, as it’s the most relevant for understanding how much you can allocate towards advertising to acquire new customers.
Let's Outline the Core Assumptions
We’ll walk through a case study example to accurately define a target CPA and overall advertising budget using the P&L for a hypothetical info product business with the following characteristics:
- The company operates in the coaching/education space
- Their main marketing channel is a webinar funnel
- They use paid ads (Google, Facebook, etc.) to drive traffic to the webinar
- The core offer sold via the webinar is a $1,500 DIY course
- They also have a higher-tier $5,000 “done-for-you” program on the back end
- Their revenue goal for the first year is $1 million
- Profitability is a must (they aren’t VC-funded)
The webinar funnel model has been a staple for info product companies for ages. Typically, it involves an opt-in page that captures a lead, followed by a video presentation/training, with a product offer made at the end.
The beauty of webinars is that even if someone doesn’t purchase right away, you’ve still obtained their contact info as a lead to follow up with and potentially sell other products down the line.
Webinars tend to be utilized for higher-ticket offers in the $500 to $2,000 range. And there’s often sales teams working to sell even more premium coaching/implementation services behind the scenes.
Accounting for All Cost Drivers
Now that we’ve outlined the key assumptions and defined webinars as the core lead gen channel, let’s map out all the cost elements that go into running an operation like this from the P&L perspective.
You’ll need to account for numerous services and line items, such as:
- The face of the brand and products – usually, the creator/founder who is the authority in the niche
- Various software tools – webinar platform, landing pages, CRM, analytics, shopping cart
- Production costs for recording, editing, and uploading webinar content
- A team to set up and manage all the tech (webinars, pages, CRM, etc.)
- If selling a “done-for-you” high-ticket program, costs for delivering that service
- Employee costs for marketing, operations, customer support
- Sales team costs if utilizing phone sales and upselling on higher-ticket services
- The advertising budget itself for paid media
- Software/Tool Costs
- Payment Processing Fees
- Content Production (webinars, ads, etc.)
- Done-For-You Service Costs
- Employee Payroll
- Sales Commissions
- Advertising Spend
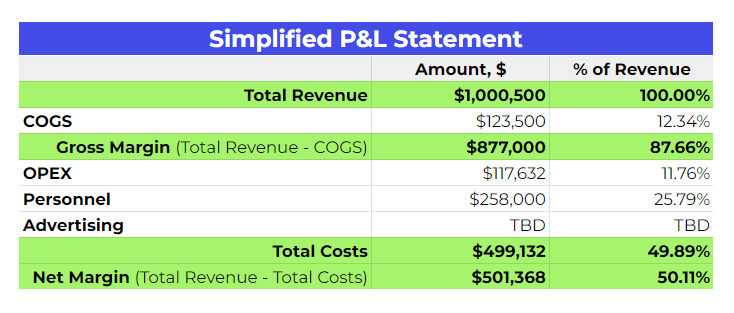
Here is a simplified view of what your P&L statement could look like:
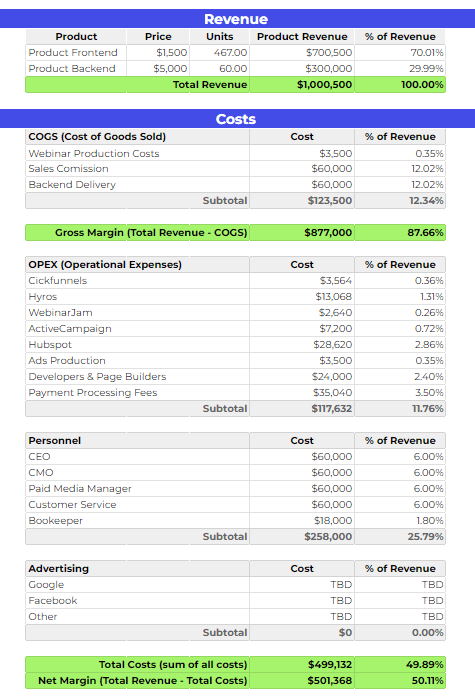
And this is a more detailed snapshot so you can see what constitutes the various costs:
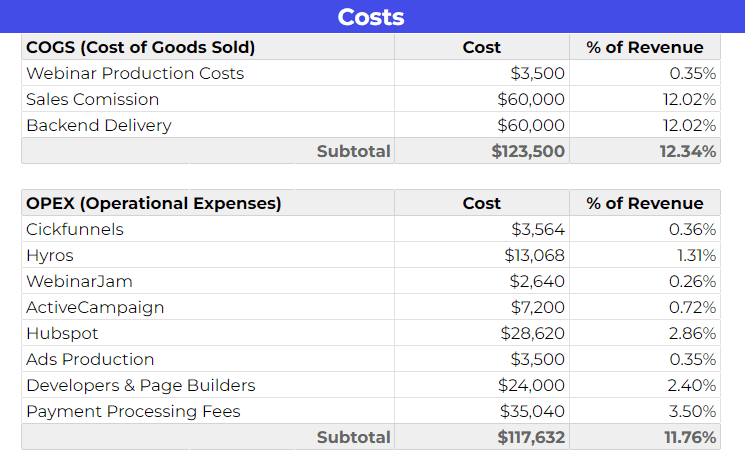
Making Sense of OPEX & COGS
You’ll also likely see line items for COGS (cost of goods sold) and OPEX (operating expenditures) which are common P&L categories that most businesses track closely.
- COGS refers to the direct costs incurred in producing/delivering your products and services.
- OPEX covers operating expenses like payroll, rent, software, etc. that are necessary to keep the business functioning.
Both COGS and OPEX are critical expenditures that get deducted from your revenue to calculate your net profitability bottom line.
Let’s zoom in a little more on those categories in our sample P&L:
So as you can see, there’s a lot that goes into mapping out an accurate P&L model for an info product business like this. But having that comprehensive view is absolutely essential for setting your business goals correctly.
What About Your Sales Team?
Let’s talk about sales teams for a minute, as they’ve become increasingly common for info product businesses in recent years. Typically, you’ll have “setters” whose job is to get potential customers booked for a call with the “closers” – the folks actually making the sales pitches.
From a business perspective, having dedicated sales teams represents a real investment in operational costs. Their compensation, usually a percentage of revenue from closed sales, gets categorized under Cost of Goods Sold or COGS.
So with each backend program or service you sell, you’re incurring direct COGS in the form of sales commissions. And if you’re delivering any kind of high-ticket coaching or implementation, you’ll also have COGS for the time/labor involved in actually delivering that service to clients.
The takeaway here is that certain product types and sales models inherently create COGS that need to be accounted for.
Selling a DIY course may have virtually no incremental cost, but selling coaching programs with a sales team definitely does.
Being mindful of where you have COGS baked into your model can save you a heap of money and help you structure your funnels more effectively. So it’s an important distinction to make when mapping out your P&L.
Okay, now back to building out that P&L model…
Calculating Your Advertising Budget
We’ve organized all our costs into their respective buckets, like software, payroll, sales commissions, and any service delivery fees. The one missing piece is the advertising budget itself, which we’ll want to solve for.
Defining Your Net Margin
For this example, we’re assuming our hypothetical info biz has two main products:
1. A $1,500 DIY training program as the frontend offer
2. A $5,000 “done-for-you” service program as the backend upsell
Their revenue goal for year 1 is $1 million total. And based on typical sales funnel metrics, we’ll assume a 70/30 split. Here, 70% of revenue comes from the frontend and 30% from the higher-ticket backend offer.
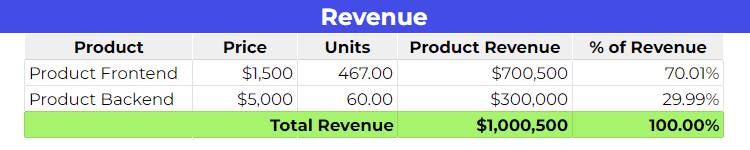
When we plug in those numbers and all other costs into our model, we can calculate a starting Net Margin of $501,000 before advertising expenses.
Net Margin shows what’s leftover from your revenue after all costs are paid. It represents the profits available to be put towards growth initiatives like advertising and marketing. In our scenario, I’d like to highlight that this is the Net Margin pre-EBITDA. We’ll delve into that in another case study.

Setting a Target Profit Margin
So with a $501k Net Margin, we can now revisit our fundamental goal for any business: generating positive free cash flow at the end of the period.
We can express this target profit number with a simple formula:
Profit = Net Margin – Advertising Costs
Rearranging that formula, we can solve for our advertising budget:
Advertising Budget = Net Margin – Desired Profit
Most healthy businesses aim for a profit margin somewhere between 20-40%. Anything above 20% is generally considered great performance. The average for S&P 500 companies is around 10-11%.
Solving for the Ad Spend Allocation
So let’s set a reasonable target of a 20% profit margin for our model. Plugging that into the formula:
Advertising Budget = $501,000 – ($1,000,000 x 20%)
= $501,000 – $200,000
= $301,000
Based on a $1 million revenue goal, a 70/30 split on products, and a 20% target profit margin, we could allocate up to $301,000 towards our paid advertising budget for customer acquisition.

Of course, this is assuming paid ads are our primary sales driver. We’d likely complement it with other owned and earned marketing tactics, which we can explore another time.
Deriving Your Target CPAs
Frontloading the Frontend Offer
Now that we have our total annual budget figure, we can break it down further to arrive at our optimal target cost per acquisition (CPA). Since the $1,500 frontend program is likely the main entry point, we’ll want to focus our CPA analysis there first.
Continuing with our 70/30 split assumption, that implies selling 467 units of the frontend program to hit $1 million in total revenue (70% of $1 million).
For the backend $5,000 program, those sales are typically driven by a sales team following up with existing frontend customers and webinar leads. So we can consider allocating the full $301,000 ad budget towards just generating frontend customers and leads
So What Is Our CPA?
That gives us this formula for our target frontend CPA:
Target CPA = $301,000 / 467 units
= $645

So based on all our assumptions and $1 million revenue goal, a $645 cost per acquisition for new frontend program customers would be acceptable and sustainable.
Scenario Planning for Revenue Goals
Now here’s where it gets really interesting… That $645 CPA isn’t set in stone! The target is flexible based on your revenue goals and projected sales mix.
For instance, if we increase our revenue goal to $2 million but keep all other costs and assumptions the same, we could effectively double our allowable CPA while maintaining the same 20% profit margin goal.
CPA vs Revenue
Let’s explore how this Target CPA would adjust with different scenarios of revenue growth:
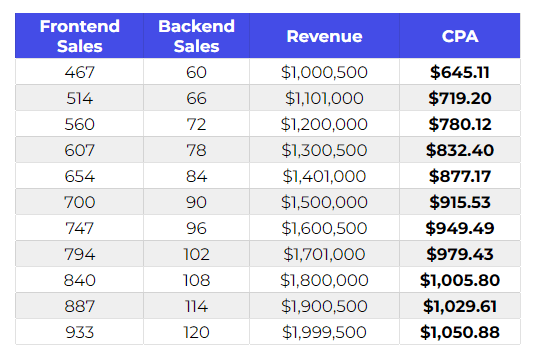
At $2 million projected revenue, the net margin increases to $1.38 million. Subtract a 20% profit figure, and now you have $980,000 to work with for your ad budget. Divide that by the adjusted 933 unit sales goal (assuming the frontend product sales still constitute 70% of revenue and the price remains $1,500), and suddenly your CPA max is up to $1,050!
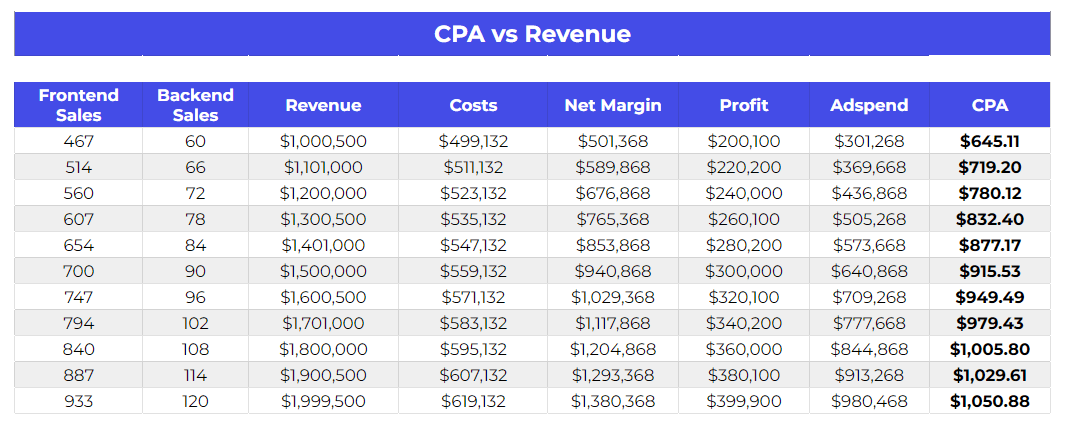
This results in a $400k profit on $2 million in revenue. Here is a more detailed breakdown:
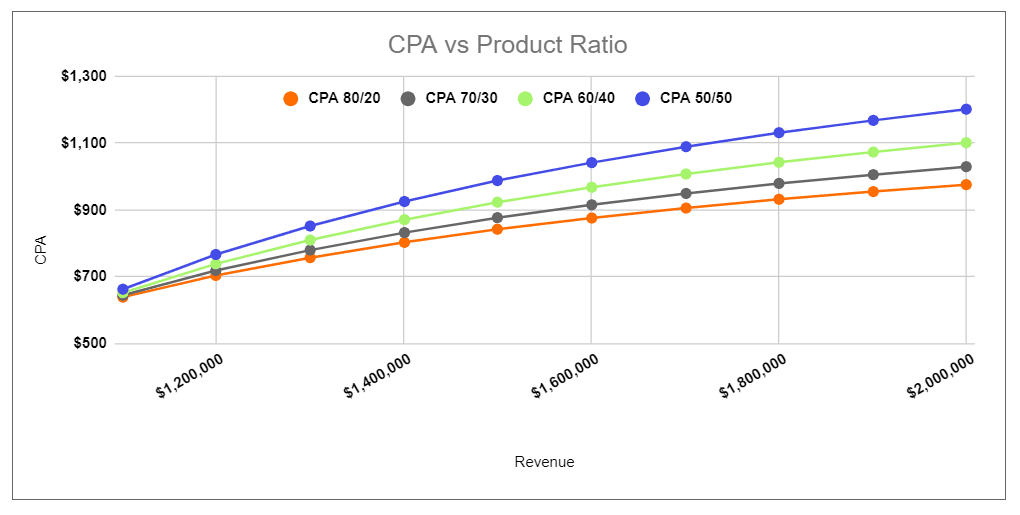
CPA vs Product Ratios
Or let’s say we adjust that 70/30 ratio, putting more emphasis on the higher-ticket backend offer. By increasing the share of revenue from backend sales, which have no ad costs, we can shift more budget to aggressive frontend prospecting.
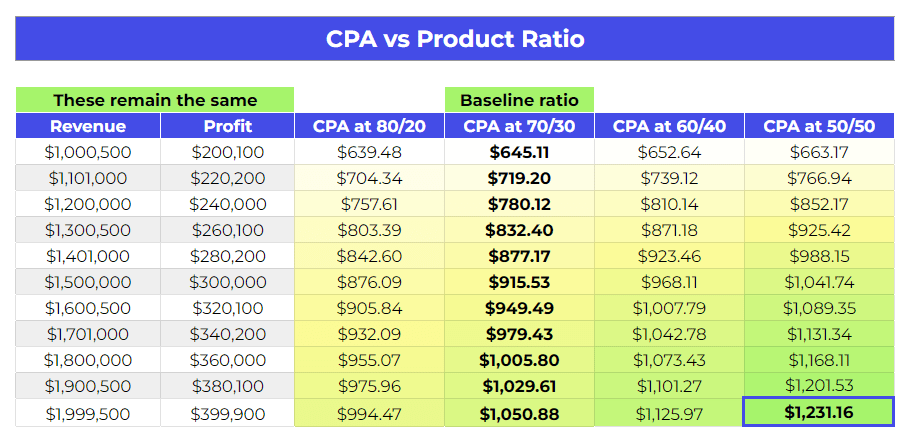
The chart below demonstrates this principle very clearly – the 50/50 breakdown results in the highest allowable CPA:
There’s a lot of levers you can pull and scenario planning you can do once you have your full P&L model built out from the ground up. The key is to ensure your spending on acquisitions matches your overarching revenue goals and profit targets.
Funneling It All the Way to CPL
Okay, let’s take a step back and look at how this process applies to lead generation as well. It gets slightly more complex, but stay with me here.
Mapping the Path to Conversion
When we map out the full funnel flow, it looks something like this:
Ad Budget → Clicks → Leads → Webinar Attendees → Frontend Sales → Backend Sales → Re-engaging Leftover Leads
Starting from the top, let’s use the context of running traffic ads on Facebook and YouTube. With our $301,000 annual budget, you could generate around 120,000 clicks at $2.50 cost per click on average (which is a reasonable benchmark for successful campaigns in this space).
Now, it’s important to note that we’re talking about clicks here, not necessarily 120,000 unique people. There’s likely some overlap where the same users click multiple ads.
From those 120,000 clicks, the typical conversion rate for turning clickers into an actual lead (e.g. someone opting in for the webinar) ranges from 10 to 20% for an info product webinar funnel. Taking the 15% average, that puts us at around 18,000 total leads generated.
The next conversion step is getting those 18,000 leads to actually show up and attend the webinar sales presentation. Assuming a 70-80% showup rate, which is standard, we’re now working with 12,600 webinar attendees.

Landing on Your Target CPL
So let’s recap the funnel metrics:
$301k Ad Budget → 120k Clicks → 18k Leads → 12.6k Webinar Attendees → ? Sales
Well, based on our target CPA of $645 and the need to sell 467 units of the frontend program, we’d require a 3.7% conversion rate from webinar attendees to paying customers.
Putting it all together with benchmarks:
$301k Budget → 120k Clicks ($2.50/click) → 18k Leads (15% conversion) → 12.6k Attendees (70% showup) → 467 Sales (3.7% conversion)
To make this whole funnel engine viable based on our assumptions and revenue goals, we’d want to be acquiring those 18,000 leads at around $16 each.
There you have it – a target $645 CPA and $16 CPL to aim for!

From Guesswork to Sustainable Growth
Key Takeaways
In closing, I’ll leave you with a few key takeaways:
1️⃣ While this is an exercise in modeling rather than an actual forecast, it deepens your understanding of your financial levers – how pricing, product mix, conversion rates, and more all impact your business . Changing one variable will have a cascading effect.
2️⃣ The value isn’t in landing on a specific CPA or CPL target, but rather deconstructing your business into its core components to identify potential bottlenecks and friction points.
3️⃣ With that awareness of how all the performance metrics and profit drivers fit together, you’re infinitely better positioned to strategically address issues and optimize the right elements.
Cutting Through Funnel Noise
At the end of the day, lacking solid numbers and financial acumen as a business owner is the starting point for so many pitfalls – getting caught in cycles of switching agencies, creative teams, or media buyers, or hiring consultants and experts to squeeze more out of conversion funnels…
Oftentimes, the bigger bottleneck lies in not fully understanding your core costs and unit economics, not being able to pinpoint where exactly your model is breaking or failing to convert.
Having a comprehensive P&L map gives you the framework to cut through the noise and methodically work on solving the right issues, from the roots up. It’s a game-changer for any product business striving for sustainable growth and profitability.
Time to Stop Flying Blind
If after reading all this you are left wondering if your current CPA and CPL targets make sense for your business, I got your back. You can get the template of the P&L framework introduced in our case study and apply it to your company to get a quick health check of your funnel.
Just fill out the form below to receive a free copy of the framework in your inbox.
And if you're feeling overwhelmed by all the moving parts involved in accurately modeling your financials, don't worry - you're not alone. Mapping out a comprehensive P&L and tying all the metrics back to an overarching revenue goal is no easy task. The good news? You don't have to figure it all out by yourself!
Click the button below to book a free top-to-bottom audit of your existing setup and gain unbiased insights on bottlenecks crippling your growth and how to plug up any profit leaks.👇
It’s time to regain full visibility into your business!

Brat Vukovich, Co-Founder of Inceptly and VidTao
Want more content like this?
Don’t miss out on the latest news and updates from the world of Direct Response advertising! Subscribe to our newsletter today 👇
Get Our Newsletter
Need Help?
Get in touch with us for an insightful evaluation of your ads + actionable tips to help amp up your direct response revenue