
[Quick update: We’re about to launch a tool that allows you to track your YouTube CPMs & compare them versus benchmarks in your market and geo. Want early access? Just reply to this email with “CPM” and we’ll make sure to add you to the early access list.]
Ever wonder what it actually costs to reach a thousand people on YouTube—country by country, screen by screen?
That question sent me digging into our own 2025 data dump: 140 markets, each with at least 5,000 impressions, sliced by device and nothing else. No industry averages, no vendor slideware—just our raw sample.
Here’s what shook out: the places where CPMs skyrocket, the corners where they barely register, and the quick tweaks already nudging those numbers in the right direction.
Quick update: Want to track your CPMs? We’re about to launch a tool that allows you to track your YouTube CPMs & compare them versus benchmarks in your market and geo. Want early access? Just reply to this email with “CPM” and we’ll make sure to add you to the early access list.
Want to brainstorm with our team on new ways to scale your business with YouTube Ads (and other performance video platforms)?
Join us for a free YouTube ad brainstorming session👇
The global picture at a glance
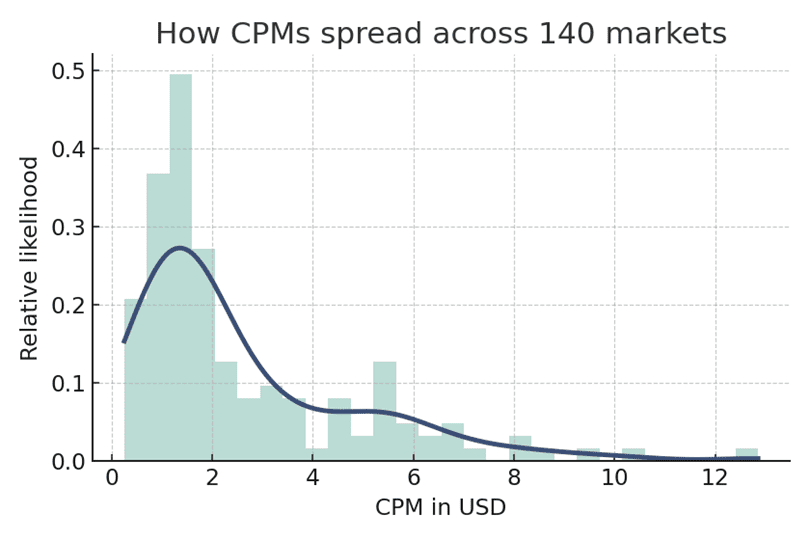
If you average everything together, you get a weighted CPM of roughly $10.68. But averages hide more than they reveal. Half the markets sit below $1.67, and the quiet middle 90 percent live between roughly $0.57 and $7.00 per thousand impressions.
The histogram on the next page shows just how skewed the distribution really is—there’s a gentle hump around the one‑dollar mark and then a long, thin tail that stretches all the way into double digits.
Not all “Tier‑1” markets are created equal
Media buyers love to lump geographies into neat boxes—Tier 1, Tier 2, ROW—but the gulf between the United States and, say, Ireland is wide enough to drive a truck through.
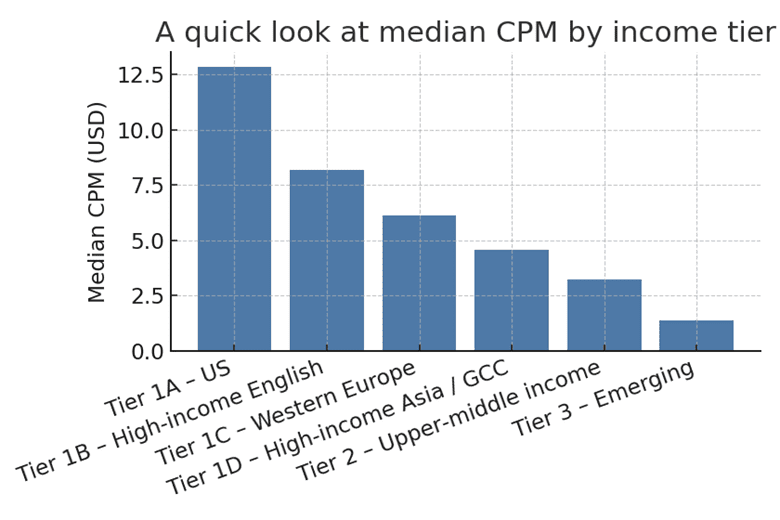
To keep it practical, I broke the world into six buckets:
The US on its own,
Four other high‑income English markets,
The core of Western Europe,
a grab‑bag of rich but smaller economies like Singapore and the UAE;
A long list of upper‑middle‑income countries, and, finally,
Everything that didn’t fit those labels.
The bar chart below tells the cost story better than words. Notice how the median
CPM drops by roughly 50 percent every time you step down a tier.

YouTube CPM by device – 2025 sample
Curiosity got the better of me, so I sliced our 2025 data by screen type. The charts and table here, again, cover the same 140 countries (≥5k impressions each).
Contrary to the usual CTV‑premium narrative, most countries show lower CPM on TV screens than on mobile. In the United States, for instance, TV averaged $10.33 while mobile came in at $14.76.
My takeaway: Smart-TV adoption has flooded the auction with supply; big screens are no longer scarce enough to demand a premium in most markets.
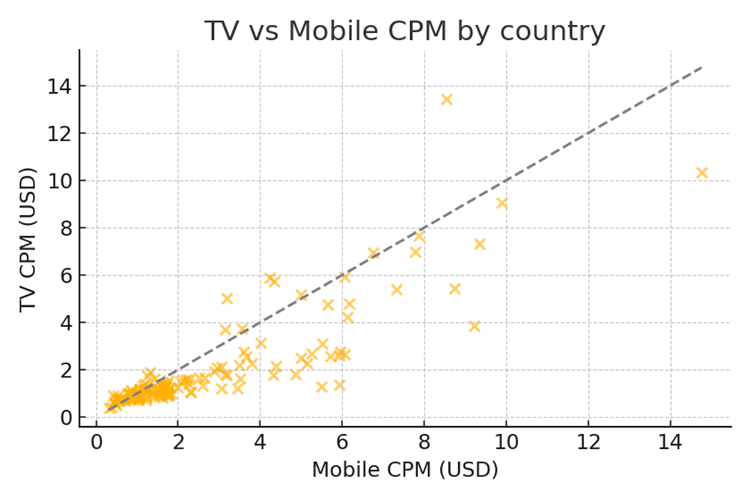
Here is the review of the chosen countries and distribution of CPMs by device. All amounts are in USD:

The old “CTV is always the most expensive screen” story just doesn’t hold up in our 2025 data. In most major markets—even the U.S.—big-screen CPMs now sit below or only slightly above mobile, wiping out the classic CTV premium.
Device-level CPM range: Median and 5th-to-95th percentile spread

How to read the percentiles:
Median – the middle of the distribution. Half of all country-device CPMs sit below this value, and half sit above it.
5th percentile – only 5 % of observations are cheaper than this number. Think of it as the “best-case bargain” end of the curve.
95th percentile – only 5 % of observations are more expensive than this figure, capturing the high-priced outliers.
So, for computers, 90% of CPMs fall between roughly $0.71 and $9.08 per thousand impressions, clustering around a $1.94 midpoint. TV screens show the narrowest spread, reinforcing that CTV isn’t carrying the premium many still assume in 2025.
Country and screen type set the baseline, but they’re only the starting point. In day-to-day optimisation, the auction price shifts far more on four levers you control:
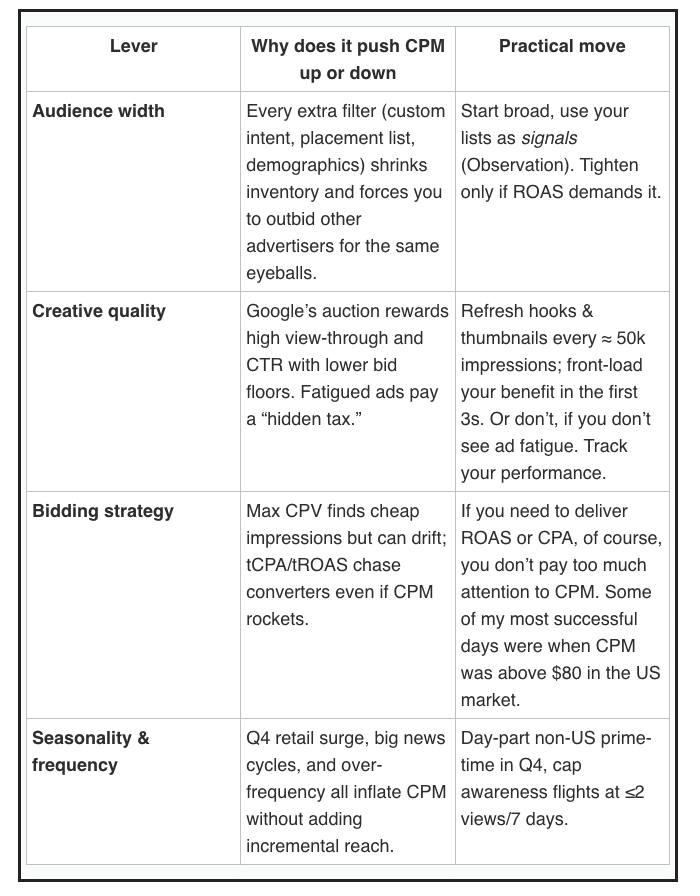
And what is the key takeaway: treat CPM as an early-warning metric.
If CPM climbs and conversions hold steady, the market is just getting louder—stay the course. If CPM rises and CPA worsens, pull one of the four levers above before you reach for the pause button.
Keep testing, keep rotating creative, and let ROAS—not the raw CPM sticker price—tell you when a market is truly too expensive.
Want to brainstorm with our team on new ways to scale your business with YouTube Ads (and other performance video platforms)?
Join us for a free YouTube ad brainstorming session👇
Want more content like this?
Don’t miss out on the latest news and updates from the world of Direct Response advertising! Subscribe to our newsletter today 👇

Bobo Slijepcevic, Director of Media Buying & Analytics
From black holes to ad clicks, Bobo took a cosmic leap from astrophysics to analytics. After years of teaching physics and explaining why Schrödinger’s cat is both alive and dead (but definitely not a good pet), he joined Inceptly in 2022. Now, he spends his days decoding YouTube metrics and buying media like a physicist shops for particles — with precision, curiosity, and the occasional caffeine boost.
Like this post? Let's continue the conversation!
Get in touch with us by shooting us a quick email or tagging us on LinkedIn or Instagram, and sharing your thoughts. Your feedback helps us keep our blog relevant and interesting.
Get Our Newsletter
Need Help?
Get in touch with us for an insightful evaluation of your ads + actionable tips to help amp up your direct response revenue